TOTAL UBE RATE
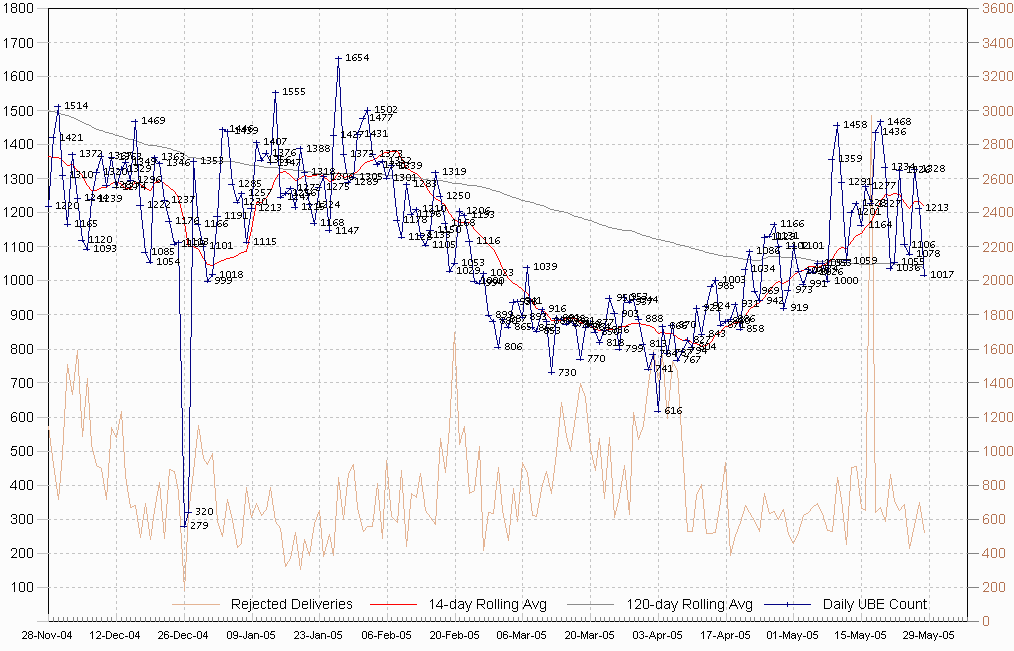
This chart shows the daily total Unsolicited Broadcast Email (UBE) count for three tiny Internet domains over a six-month period. Collection of statistics began 1-Jan-2000.
A chart showing the daily arrival rate of hostile attachments (worms/viruses) is here.
The daily rejected delivery count is also shown on this chart. Rejected deliveries mostly comprise "no such user" errors (almost entirely generated by dictionary-attack software that attempts to guess valid account names for the benefit of spammers). The remainder reflect traffic that has been rejected based on our local deny list. NOTE that the rejected-delivery data plot (light brown trace) uses the graph scale on the right edge of the graph.
This data set display is updated approximately once per week. Last Update: 03-Jun-2005 10:58 US Central Standard Time.
Current (Last 180 Days)

NOTE: The anomalously low counts on 26-Dec-2004 and 27-Dec-2004 reflect the effects of a network service interruption lasting approximately 36 hours.
Earlier Data
Charts for years 2000, 2001, 2002, 2003, 2004Send comments to abuse@tesp.com
View statistics for a dormant AOL account
Read a tale of email lists gone horribly wrong
Back to T E S P Home Page.