tesp.com Daily Hostile Attachment Count
This chart shows the daily count of hostile executable attachments
(trojans, worms, viruses &c.) quarantined by the mail server
rabendary.tesp.com.
NOTE that an unusually high peak-to-average
ratio in recent data has made it necessary to adopt a logarithmic
scale for the Y axis.
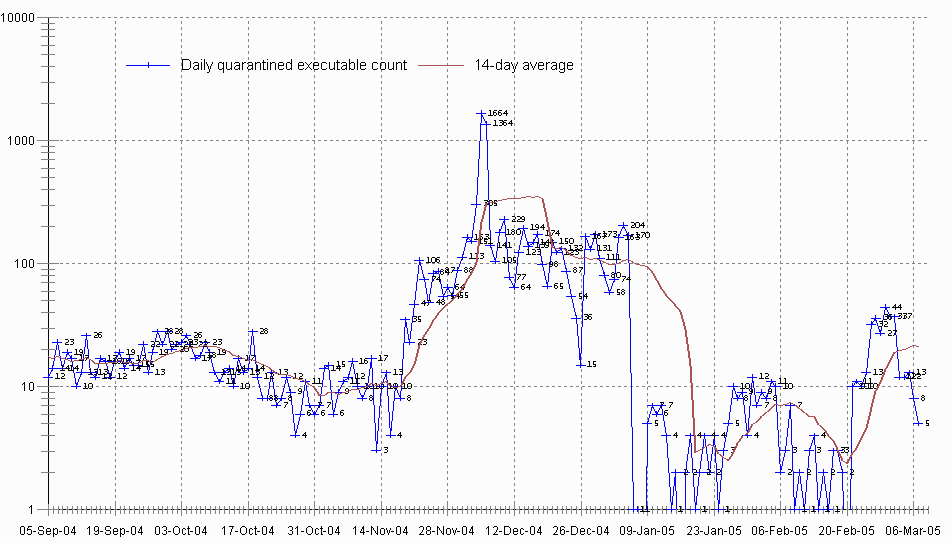
Last update: 08-Mar-2005 14:38 US Central Standard Time.